

Marwah explains how MARKUS Reports can transform the way you work…
If you are an experienced user of MARKUS, you’ll already know all about our fabulous reports – but it’s nice to have a reminder.
In MARKUS, we have over 700 reports spanning a wide range of data – from information about visits to information about costs, and much more. These reports mean that you don’t have to manually create your own reports every time you need them, which saves you time and prevents human error.
How to use reports
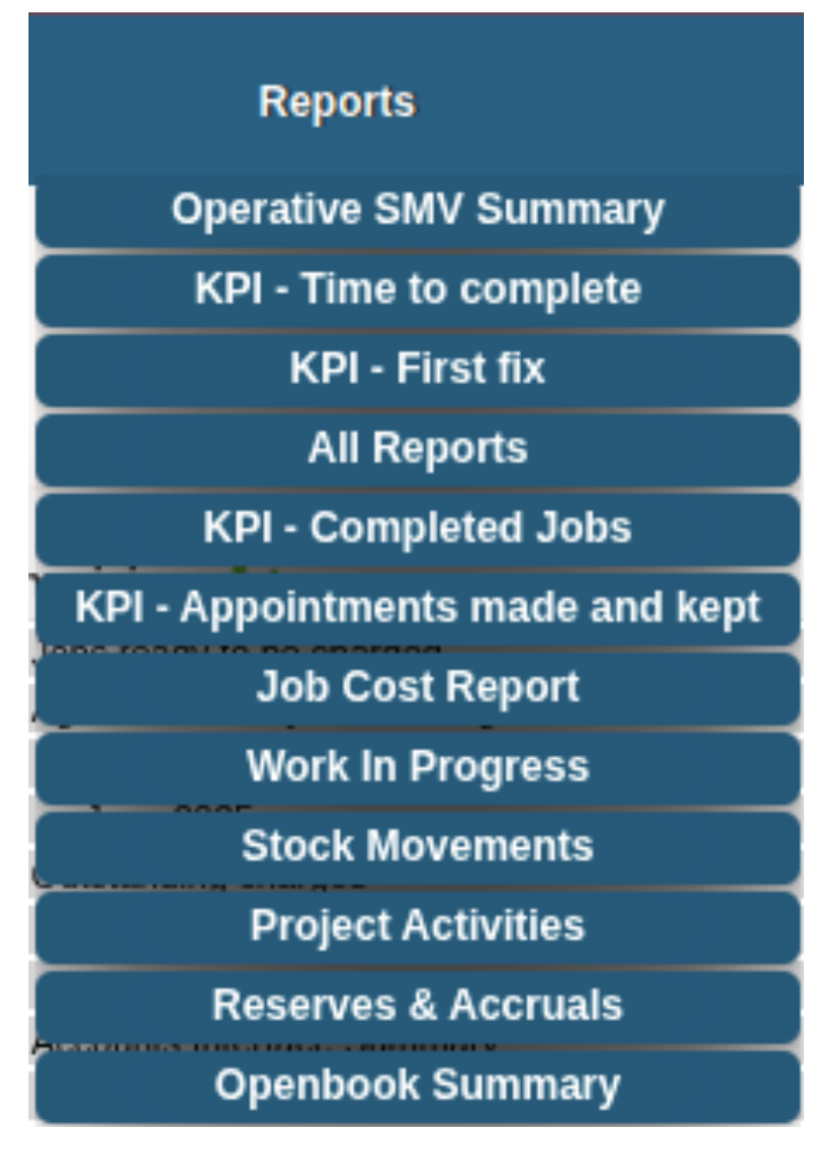
The report menu is in the top banner of your screen, and when you click on it the dropdown directs you to your pinned reports, as well as the ‘all reports’ screen.
If you find a report you like and would like to use it frequently, you can pin it to your reports menu once you’ve run it by pressing the ‘pin’ button in the top right corner.
Report fields can be sorted in either ascending or descending order by pressing the title of the field. A green arrow will appear in the heading to indicate whether it has been sorted in ascending or descending order.
For example, in this report I have sorted the data by ‘received date’ (descending).
 Filtering
Report data can also be filtered by relevant categories, which makes it even easier to get the information you need out of MARKUS without any hassle.
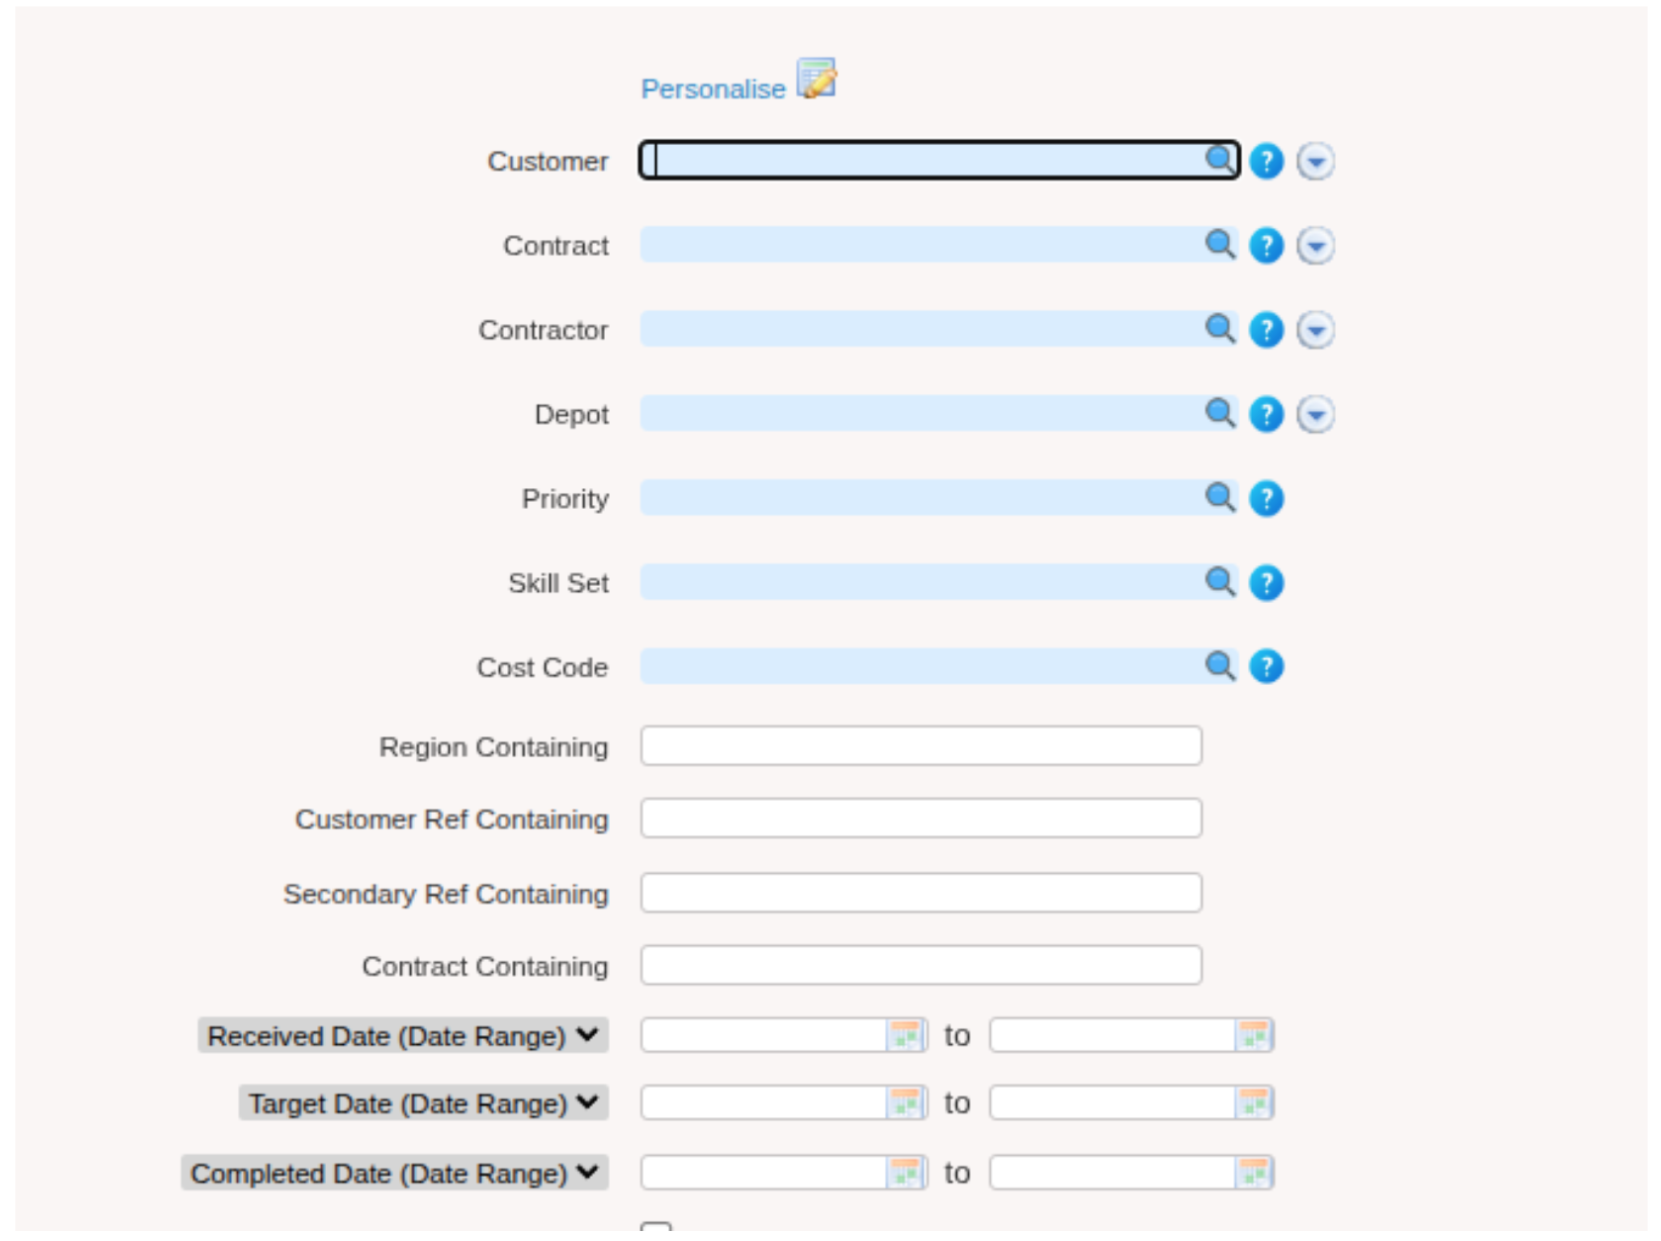
You can filter by the filter screen that appears when you click on a report, like this one:
But you can also edit the filters applied to the report once it has been generated:
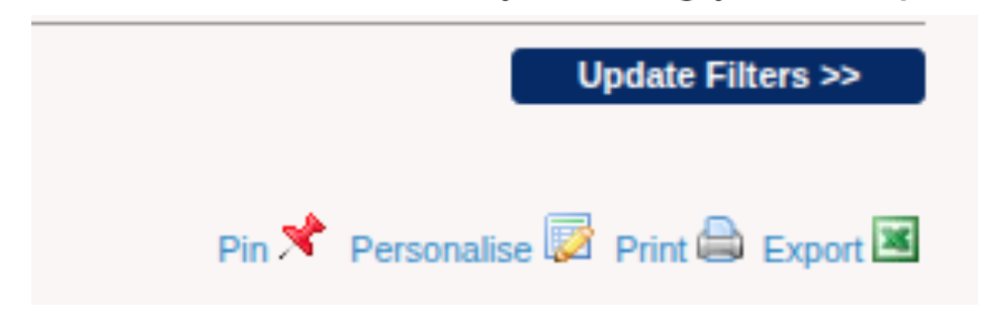
To add a filter, click on the blue text above the generated report, fill in the relevant information, and press ‘Update filters’.
 To remove a filter, simply press the green tick button near the applied filter, and then press ‘Update filters’.
 The ability to filter once the report has been generated means that you don’t have to start right from the beginning if you’ve forgotten to apply a filter you needed, making the process even easier.
Exporting
Reports can also be exported easily using the ‘Export’ button that appears on the top right side of the report. Not only do we provide thorough reporting tools, we also make it easy to share this information by allowing you to export the generated report as a CSV file or a PDF.
Personalising reports
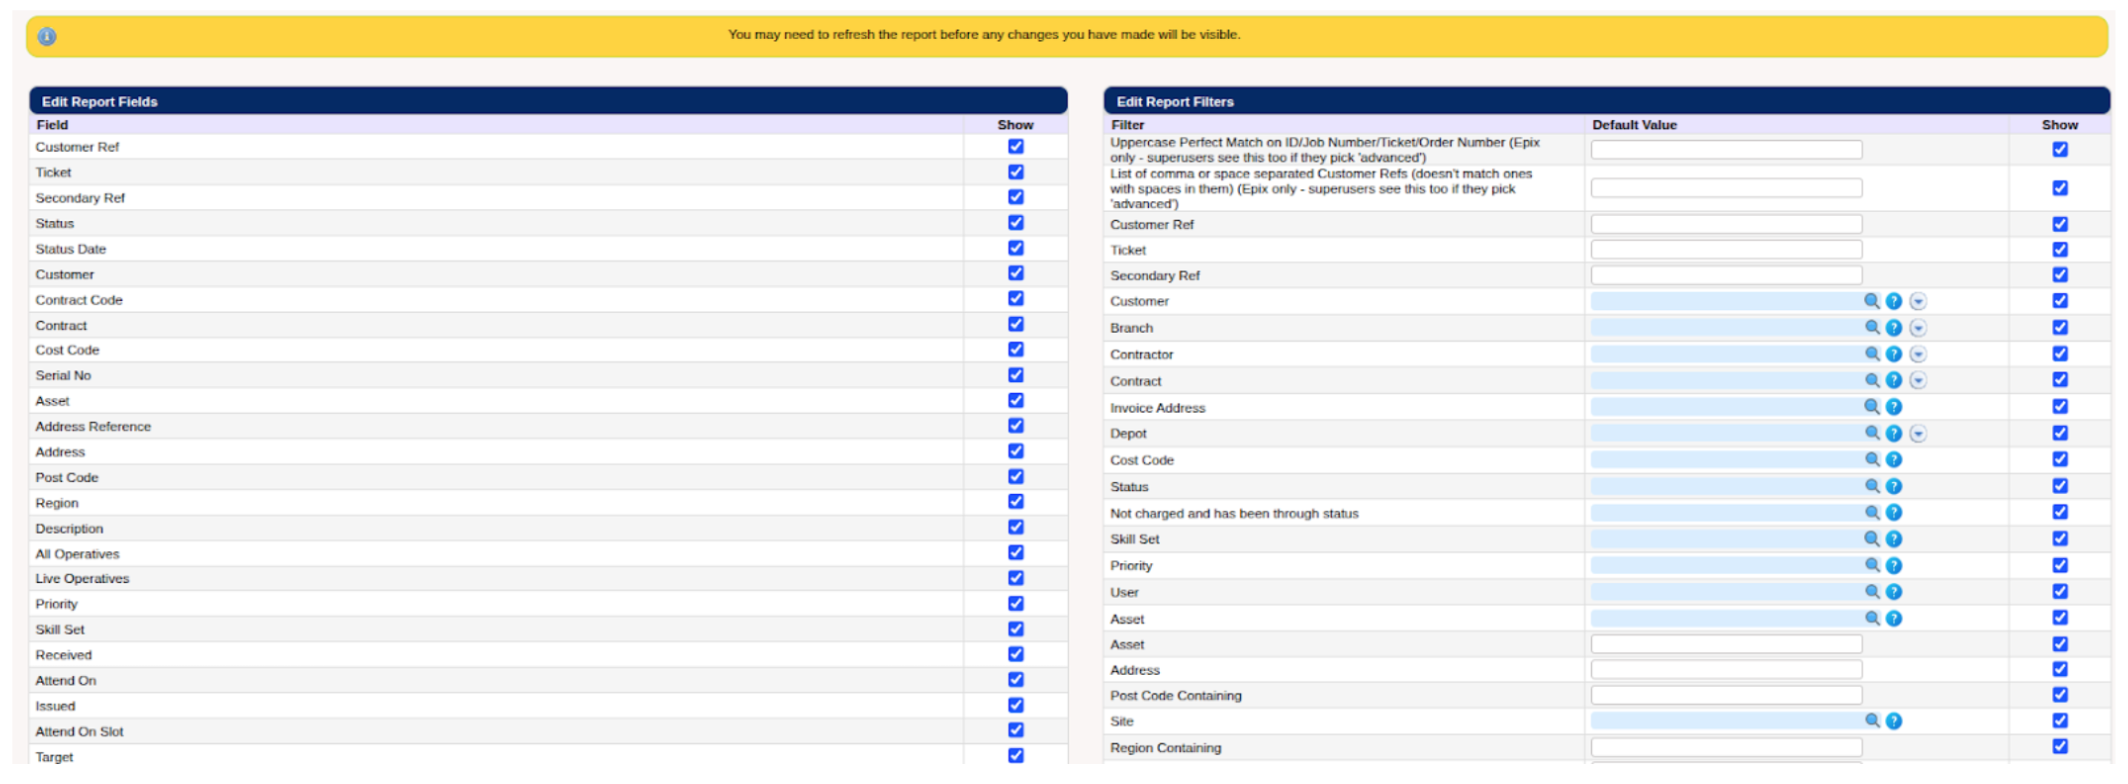
If there are certain columns you don’t want to be shared, don’t worry! You can remove specific report fields by clicking the ‘Personalise’ button that is situated near the ‘Export’ button. This takes you to a screen where you can easily tick and untick the fields you want to appear on the report. Be sure to press ‘Save Preferences’ and refresh the screen, and then export your report with the specific columns you require. This makes reports client-safe by preventing anyone from being able to see information they shouldn’t be able to! This also makes reports easier to read for yourselves too as it may be you only need to see a handful of the available fields.
Here are the three reports I think are most useful:
Job site report: the job site report is a comprehensive report, referred to by Ian as the ‘swiss army knife of reports’. It contains information about the job for all departments – from financial to operational. The report can also be broken down by a number of different categories, preventing the user from being overwhelmed by an overload of information.
Job visits log: the job visits log is super handy for operational managers because it contains information specific to visits made by an operative. It details information about the operative’s travel hours, time to complete jobs, and some financial information to do with the operative’s labour/sale costs.
Survey answers by address: this report displays survey answers. By filtering by ‘answer containing’, you can generate a report that details every time a specific answer was given, which is super helpful.
If you have any questions about anything regarding reports, have a watch of Chris’ webinar on the topic here: https://www.youtube.com/watch?v=Wk3L6PzdSHE, or feel free to give us a call on 0161 477 2343!

